---
title: "11. Instrumental Variables and 2SLS"
subtitle: "Endogeneity, the IV and 2SLS estimators, weak instruments, and LATE"
---
When a regressor is correlated with the error --- whether from omitted variables, measurement error, or simultaneity --- OLS is [inconsistent](ch08-asymptotics.qmd#sec-consistency). No amount of data fixes this. **Instrumental variables** (IV) offer a way out: find a variable $Z$ that shifts the endogenous regressor but is otherwise unrelated to the outcome.
This chapter builds the IV toolkit through simulation and application:
1. **Why does OLS fail?** (endogeneity, inconsistency)
2. **How does IV work?** (the estimator, the Wald ratio, `iv_robust()`)
3. **What about overidentification?** (2SLS, building it by hand)
4. **Is my instrument strong enough?** (first-stage F, weak instrument bias)
5. **Can I test for endogeneity?** (control function / Hausman test)
6. **What does IV estimate under heterogeneity?** (LATE, compliers)
7. **Applied example** (cigarette demand elasticity)
```{r}
#| label: setup
#| message: false
library(ggplot2)
library(sandwich)
library(lmtest)
library(estimatr)
library(car)
library(carData)
library(AER)
options(digits = 4)
```
## The endogeneity problem
Suppose the true model is $Y = 1 + 0.5 X + e$, but $X$ and $e$ are correlated. We generate this by letting both $X$ and $e$ depend on an unobserved confounder:
```{r}
#| label: endogeneity-dgp
set.seed(42)
n <- 500

## Data-generating process
z <- rnorm(n)               # instrument (exogenous)
v <- rnorm(n)               # first-stage error
e <- 0.8 * v + rnorm(n, sd = 0.5)  # structural error (correlated with v!)
x <- 1.5 * z + v            # endogenous regressor
y <- 1 + 0.5 * x + e        # structural equation
dat <- data.frame(y, x, z)
```
Because $v$ appears in both $x$ and (through $e$), $\text{Cor}(x, e) \neq 0$. OLS is biased *and inconsistent*:
```{r}
#| label: ols-biased
ols <- lm(y ~ x, data = dat)
cat("True β =", 0.5, "\n")
cat("OLS β =", round(coef(ols)["x"], 4), "\n")
```
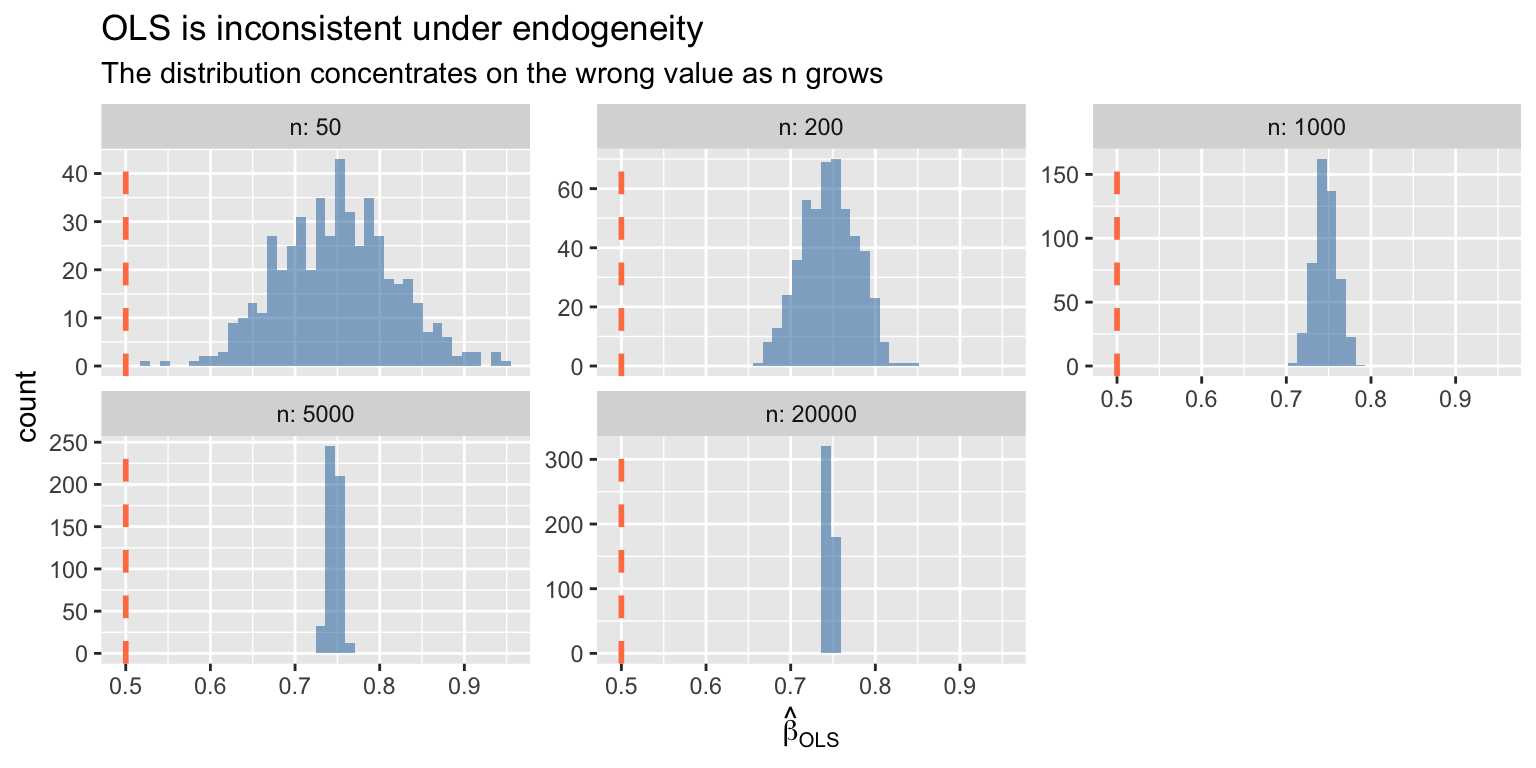
The bias does not vanish with more data --- OLS converges to the wrong value:
```{r}
#| label: ols-inconsistency
#| fig-cap: "OLS is inconsistent under endogeneity — the distribution concentrates on the wrong value"
#| fig-width: 8
#| fig-height: 4
set.seed(1)
n_vals <- c(50, 200, 1000, 5000, 20000)
B <- 500

sim_ols <- function(n) {
  z <- rnorm(n)
  v <- rnorm(n)
  e <- 0.8 * v + rnorm(n, sd = 0.5)
  x <- 1.5 * z + v
  y <- 1 + 0.5 * x + e
  coef(lm(y ~ x))[2]
}

df_ols <- do.call(rbind, lapply(n_vals, function(nn) {
  data.frame(estimate = replicate(B, sim_ols(nn)), n = nn)
}))

ggplot(df_ols, aes(x = estimate)) +
  geom_histogram(bins = 40, alpha = 0.6, fill = "steelblue") +
  geom_vline(xintercept = 0.5, linetype = "dashed", color = "coral", linewidth = 1) +
  facet_wrap(~ n, labeller = label_both, scales = "free_y") +
  labs(title = "OLS is inconsistent under endogeneity",
       subtitle = "The distribution concentrates on the wrong value as n grows",
       x = expression(hat(beta)[OLS]))
```
::: {.callout-note}
## Endogeneity Means Inconsistency
When $\text{Cov}(X, e) \neq 0$, OLS converges to the wrong value — bias does not shrink with larger samples. This is fundamentally different from finite-sample bias (which vanishes as $n \to \infty$). IV trades precision for consistency.
:::
## The IV estimator {#sec-iv-estimator}
The IV estimator uses the instrument $Z$ (which is uncorrelated with $e$) to isolate the exogenous variation in $X$:
$$\hat{\beta}_{IV} = (Z'X)^{-1} Z'Y$$ {#eq-iv}
This is the sample analogue of $\beta = \text{Cov}(Z, Y) / \text{Cov}(Z, X)$.
::: {#thm-iv}
## IV Estimator
The IV estimator $\hat\beta_{IV} = (Z'X)^{-1}Z'Y$ is consistent for $\beta$ when $\mathbb{E}[Z_i e_i] = 0$ (instrument exogeneity) and $\mathbb{E}[Z_i X_i'] \neq 0$ (instrument relevance). It is the sample analogue of $\beta = \text{Cov}(Z, Y) / \text{Cov}(Z, X)$.
:::
```{r}
#| label: iv-by-hand
## IV by hand (just-identified: one instrument, one endogenous regressor)
Z <- cbind(1, dat$z)   # instrument matrix (with intercept)
X <- cbind(1, dat$x)   # regressor matrix

beta_iv <- solve(t(Z) %*% X) %*% t(Z) %*% dat$y
cat("IV estimate (by hand):", round(beta_iv[2], 4), "\n")
cat("True β: ", 0.5, "\n")
```
### Using `iv_robust()`
The `estimatr` package provides `iv_robust()`, which handles 2SLS estimation with heteroskedasticity-robust standard errors:
```{r}
#| label: iv-robust
## Syntax: Y ~ endogenous + exogenous | instruments + exogenous
iv_fit <- iv_robust(y ~ x | z, data = dat)
summary(iv_fit)
```
The coefficient on `x` is close to the true value of 0.5. Compare to OLS:
```{r}
#| label: ols-vs-iv
data.frame(
  Estimator = c("OLS", "IV"),
  Estimate = c(coef(ols)["x"], coef(iv_fit)["x"]),
  SE = c(sqrt(vcovHC(ols)["x", "x"]), iv_fit$std.error["x"]),
  row.names = NULL
)
```
IV is consistent but less precise --- the standard error is larger. This is the cost of correcting for endogeneity.
### The Wald estimator
When the instrument is **binary**, the IV estimator simplifies to the **Wald ratio**: the reduced-form effect on $Y$ divided by the first-stage effect on $X$.
```{r}
#| label: wald-estimator
## Create a binary instrument version
set.seed(42)
n <- 1000
z_bin <- rbinom(n, 1, 0.5)          # binary instrument
v <- rnorm(n)
e <- 0.8 * v + rnorm(n, sd = 0.5)
x <- 0.6 * z_bin + v                 # first stage
y <- 1 + 0.5 * x + e                 # structural equation

## Wald estimator by hand
y1 <- mean(y[z_bin == 1]); y0 <- mean(y[z_bin == 0])
x1 <- mean(x[z_bin == 1]); x0 <- mean(x[z_bin == 0])
wald <- (y1 - y0) / (x1 - x0)

cat("Reduced form (Y):  ", round(y1 - y0, 4), "\n")
cat("First stage (X): ", round(x1 - x0, 4), "\n")
cat("Wald estimate: ", round(wald, 4), "\n")
cat("True β: 0.5\n")
```
The Wald ratio is the intent-to-treat (ITT) effect on $Y$ rescaled by the first-stage compliance rate. This is the building block of LATE, which we develop below.
## Two-stage least squares {#sec-2sls}
When there are **more instruments than endogenous regressors** ($l > k$, overidentification), we use **2SLS**:
- **Stage 1**: Regress $X$ on all instruments $Z$ to get fitted values $\hat{X} = P_Z X$
- **Stage 2**: Regress $Y$ on $\hat{X}$ (but compute SEs using the original $X$)
::: {#thm-2sls}
## Two-Stage Least Squares
The 2SLS estimator $\hat\beta_{2SLS} = (X'P_Z X)^{-1}X'P_Z Y$, where $P_Z = Z(Z'Z)^{-1}Z'$, handles overidentification ($\ell > k$) by projecting $X$ onto the instrument space before applying OLS. It equals the GMM estimator with weight matrix $(Z'Z)^{-1}$.
:::
```{r}
#| label: 2sls-simulation
## DGP with two instruments for one endogenous regressor
set.seed(42)
n <- 500
z1 <- rnorm(n)
z2 <- rnorm(n)
v <- rnorm(n)
e <- 0.8 * v + rnorm(n, sd = 0.5)
x <- 0.8 * z1 + 0.6 * z2 + v   # two instruments
y <- 1 + 0.5 * x + e

dat2 <- data.frame(y, x, z1, z2)
```
### 2SLS by hand
```{r}
#| label: 2sls-by-hand
## Stage 1: regress X on instruments
stage1 <- lm(x ~ z1 + z2, data = dat2)
dat2$x_hat <- fitted(stage1)

## Stage 2: regress Y on fitted X
stage2_naive <- lm(y ~ x_hat, data = dat2)

## The coefficient is correct, but the SEs are wrong!
## Correct SEs use the original X, not x_hat
cat("2SLS coefficient (from two stages):", round(coef(stage2_naive)["x_hat"], 4), "\n")
cat("Naive SE (wrong): ", round(summary(stage2_naive)$coef["x_hat", 2], 4), "\n")
```
The naive second-stage SEs are **incorrect** because they treat $\hat{X}$ as if it were $X$. The `iv_robust()` function handles this automatically:
```{r}
#| label: 2sls-correct
iv_fit2 <- iv_robust(y ~ x | z1 + z2, data = dat2)
cat("2SLS coefficient (iv_robust):      ", round(coef(iv_fit2)["x"], 4), "\n")
cat("Correct robust SE: ", round(iv_fit2$std.error["x"], 4), "\n")
```
### Verifying the matrix formula
The 2SLS estimator is $\hat{\beta}_{2SLS} = (X'P_Z X)^{-1} X'P_Z Y$ where $P_Z = Z(Z'Z)^{-1}Z'$:
```{r}
#| label: 2sls-matrix
Z <- cbind(1, dat2$z1, dat2$z2)
X <- cbind(1, dat2$x)
Y <- dat2$y

PZ <- Z %*% solve(t(Z) %*% Z) %*% t(Z)
beta_2sls <- solve(t(X) %*% PZ %*% X) %*% t(X) %*% PZ %*% Y

cat("Matrix formula:", round(beta_2sls[2], 4), "\n")
cat("iv_robust(): ", round(coef(iv_fit2)["x"], 4), "\n")
```
## Instrument strength and weak instruments
IV pays for consistency with precision. The asymptotic variance of IV relative to OLS is:
$$\text{Avar}(\hat{\beta}_{IV}) = \frac{\text{Avar}(\hat{\beta}_{OLS})}{\rho^2_{ZX}}$$
When the instrument is weak ($\rho_{ZX} \approx 0$), IV becomes wildly imprecise and biased. The **first-stage F-statistic** measures instrument strength.
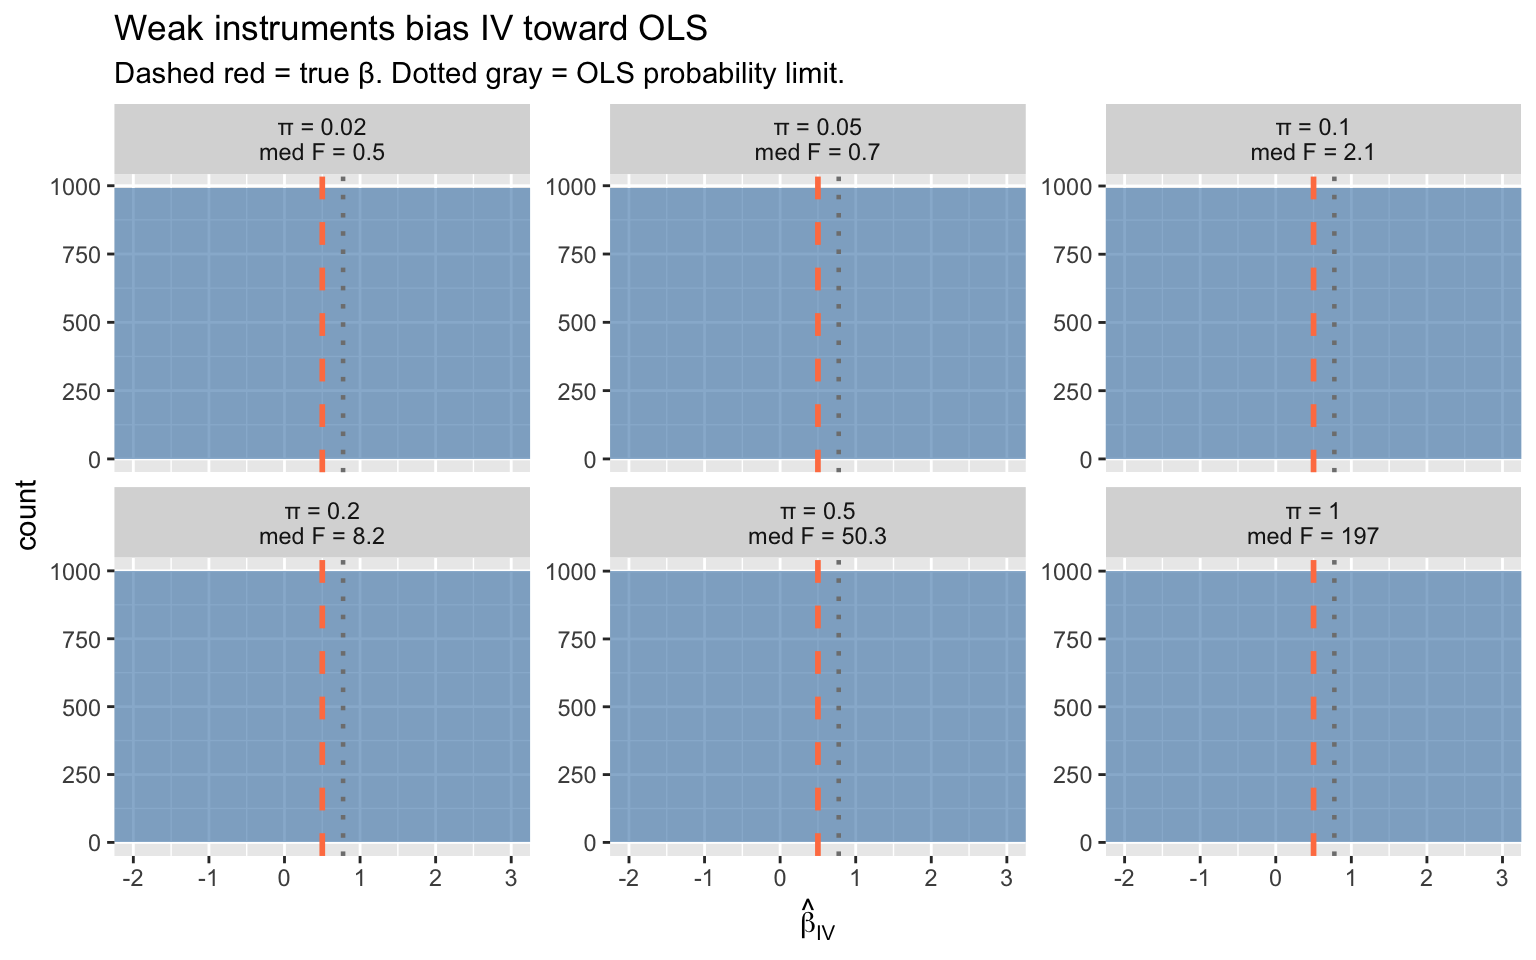
### Simulation: bias grows as instruments weaken
```{r}
#| label: weak-instrument-sim
#| fig-width: 8
#| fig-height: 5
set.seed(12)
B <- 1000
n <- 200

## Vary the first-stage coefficient (instrument strength)
pi_vals <- c(0.02, 0.05, 0.1, 0.2, 0.5, 1.0)

results <- do.call(rbind, lapply(pi_vals, function(pi) {
  estimates <- replicate(B, {
    z <- rnorm(n)
    v <- rnorm(n)
    e <- 0.8 * v + rnorm(n, sd = 0.5)
    x <- pi * z + v
    y <- 1 + 0.5 * x + e
    fit <- iv_robust(y ~ x | z, data = data.frame(y, x, z))
    c(iv = coef(fit)["x"],
      F_stat = summary(lm(x ~ z))$fstatistic[1])
  })
  data.frame(
    pi = pi,
    iv_est = estimates["iv.x", ],
    F_stat = estimates["F_stat.value", ],
    label = paste0("π = ", pi, "\nmed F = ", round(median(estimates["F_stat.value", ]), 1))
  )
}))

ggplot(results, aes(iv_est)) +
  geom_histogram(bins = 50, alpha = 0.6, fill = "steelblue") +
  geom_vline(xintercept = 0.5, color = "coral", linetype = "dashed", linewidth = 1) +
  geom_vline(xintercept = coef(lm(y ~ x, data = dat))["x"],
             color = "gray50", linetype = "dotted", linewidth = 0.8) +
  facet_wrap(~ label, scales = "free_y") +
  coord_cartesian(xlim = c(-2, 3)) +
  labs(title = "Weak instruments bias IV toward OLS",
       subtitle = "Dashed red = true β. Dotted gray = OLS probability limit.",
       x = expression(hat(beta)[IV]))
```
Key patterns:
- **Strong instruments** (large $\pi$, high F): IV is centered on the true value
- **Weak instruments** (small $\pi$, low F): IV is biased toward OLS and has enormous variance
- The **F > 10 rule of thumb** (Staiger & Stock 1997) marks the boundary of acceptable instrument strength
::: {.callout-warning}
## Weak Instruments: F < 10 Rule of Thumb
When the first-stage F-statistic is below 10 (Staiger & Stock, 1997), IV is biased toward OLS, wildly imprecise, and confidence intervals have poor coverage. Always report the first-stage F and treat results with F < 10 as unreliable.
:::
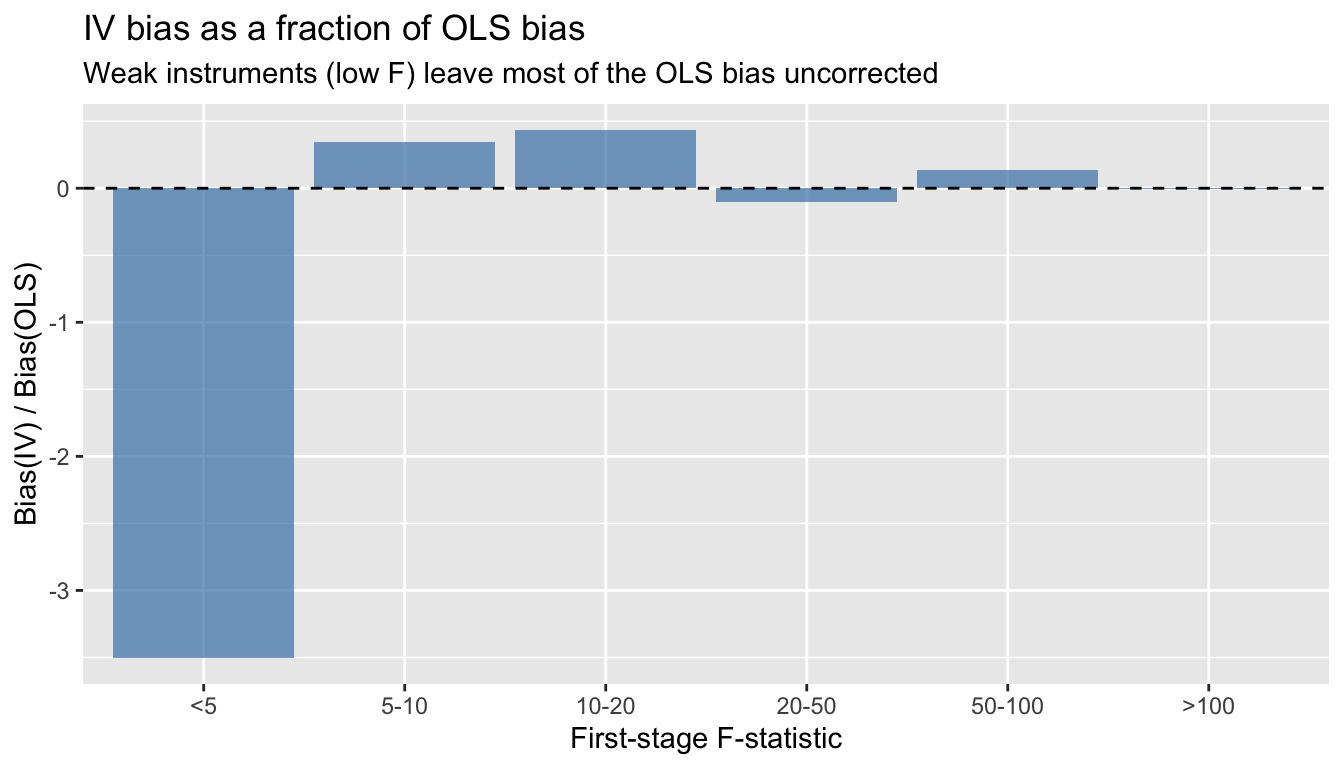
### The bias formula
The approximate bias of IV relative to OLS is:
$$\frac{\text{Bias}(\hat{\beta}_{IV})}{\text{Bias}(\hat{\beta}_{OLS})} \approx \frac{1}{F}$$ {#eq-2sls}
```{r}
#| label: bias-vs-F
#| fig-width: 7
#| fig-height: 4
## Compute median bias ratio by F-stat bins
results$F_bin <- cut(results$F_stat, breaks = c(0, 5, 10, 20, 50, 100, Inf),
                     labels = c("<5", "5-10", "10-20", "20-50", "50-100", ">100"))

bias_ols <- 0.8 / (0.8^2 + 1)  # approximate OLS bias (rho_xe * sigma_e / sigma_x)
bias_by_F <- aggregate(iv_est ~ F_bin, data = results, function(x) mean(x) - 0.5)
bias_by_F$bias_ratio <- bias_by_F$iv_est / bias_ols

ggplot(bias_by_F, aes(F_bin, bias_ratio)) +
  geom_col(fill = "steelblue", alpha = 0.7) +
  geom_hline(yintercept = 0, linetype = "dashed") +
  labs(title = "IV bias as a fraction of OLS bias",
       subtitle = "Weak instruments (low F) leave most of the OLS bias uncorrected",
       x = "First-stage F-statistic", y = "Bias(IV) / Bias(OLS)")
```
## Testing: endogeneity and instrument validity
### The Hausman test via the control function
The **control function** approach makes endogeneity testing transparent. Add the first-stage residuals $\hat{v}$ to the structural equation. If their coefficient $\hat{\alpha}$ is significant, $X$ is endogenous:
```{r}
#| label: control-function
## Use the overidentified simulation data
stage1 <- lm(x ~ z1 + z2, data = dat2)
dat2$v_hat <- residuals(stage1)

## Control function regression
cf_reg <- lm(y ~ x + v_hat, data = dat2)
coeftest(cf_reg, vcov. = vcovHC(cf_reg, type = "HC1"))
```
The coefficient on `x` is the IV estimate of $\beta$. The t-test on `v_hat` is the **Hausman endogeneity test** --- if significant, $X$ is endogenous and IV is needed.
```{r}
#| label: hausman-verify
cat("Control function β on x:", round(coef(cf_reg)["x"], 4), "\n")
cat("2SLS β: ", round(coef(iv_fit2)["x"], 4), "\n")
cat("Hausman p-value (α = 0):", round(coeftest(cf_reg)["v_hat", 4], 4), "\n")
```
The two estimates are numerically identical (under homoskedasticity). The Hausman test rejects, confirming that OLS is inconsistent here.
### The Sargan test for overidentifying restrictions
With more instruments than endogenous regressors ($l > k$), we can test whether the **extra** instruments are valid. The **Sargan/J-test** checks whether the overidentifying restrictions hold:
```{r}
#| label: sargan-test
## Sargan test by hand
## iv_robust stores residuals as y - X %*% beta_2sls
e_hat <- dat2$y - iv_fit2$fitted.values
sargan_reg <- lm(e_hat ~ z1 + z2, data = dat2)
J_stat <- n * summary(sargan_reg)$r.squared
q <- 1  # l - k = 3 instruments - 2 parameters = 1 overidentifying restriction
p_sargan <- 1 - pchisq(J_stat, q)

cat("Sargan J-statistic:", round(J_stat, 3), "\n")
cat("p-value: ", round(p_sargan, 3), "\n")
cat("(Fail to reject => instruments are consistent with validity)\n")
```
The Sargan test cannot detect invalid instruments if *all* instruments are invalid in the same way. It only has power when some instruments are valid and others are not.
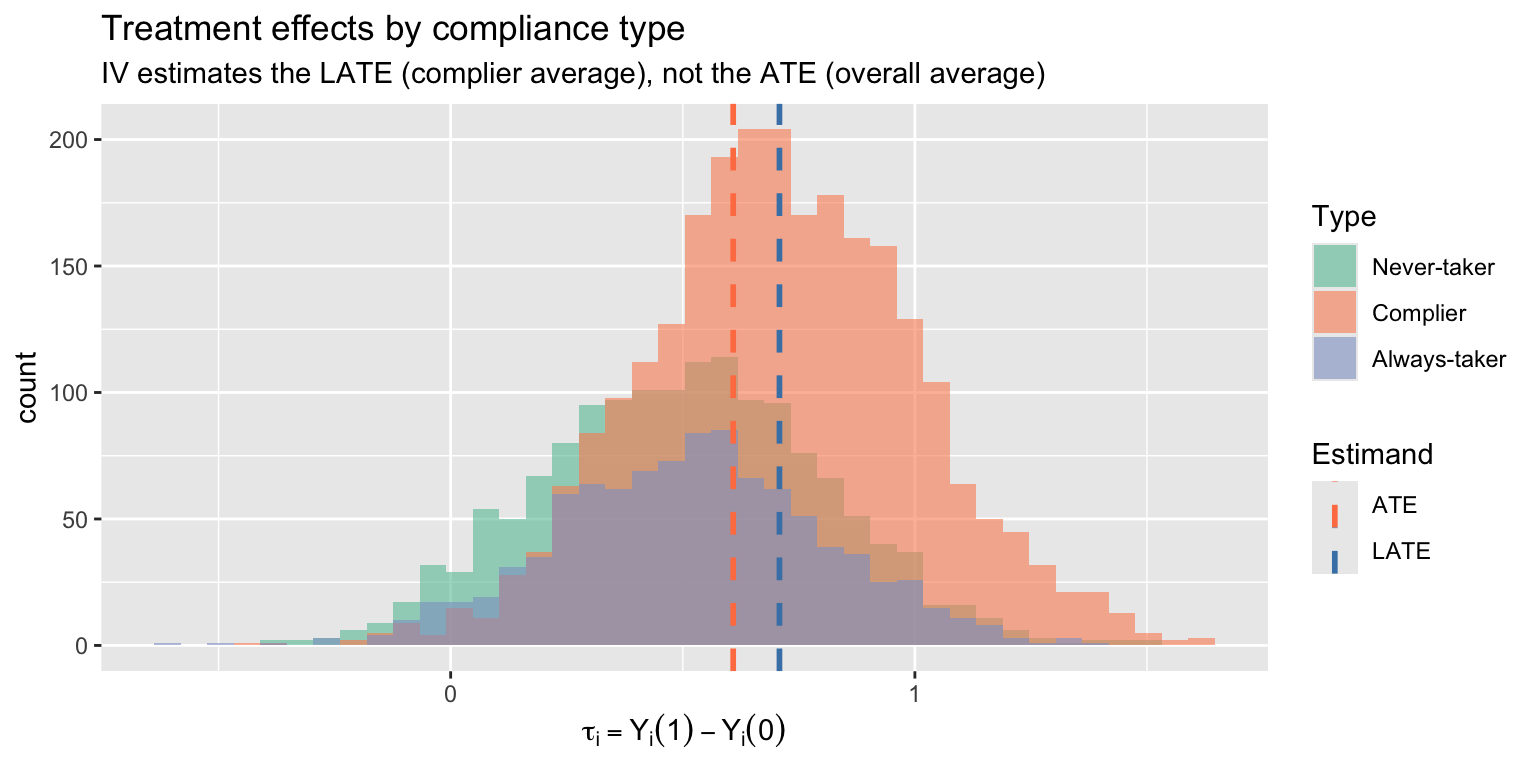
## LATE: what does IV estimate under heterogeneity?
When treatment effects vary across individuals, IV does not estimate the **average treatment effect** (ATE). With a binary instrument, it estimates the **Local Average Treatment Effect** (LATE) --- the effect for **compliers**, those whose treatment status is changed by the instrument.
::: {#def-late}
## Local Average Treatment Effect (LATE)
With a binary instrument, IV estimates the LATE: the average treatment effect for **compliers** — individuals whose treatment status is changed by the instrument. LATE is instrument-dependent: different instruments identify different complier populations.
:::
::: {.callout-warning}
## LATE Is Local
IV does not estimate the average treatment effect (ATE) for the full population. It estimates the effect for compliers only — a subgroup that cannot be identified individually. With heterogeneous effects, different instruments give different LATEs.
:::
### Simulation with heterogeneous effects
```{r}
#| label: late-simulation
set.seed(303)
n <- 5000

## Individual treatment effects: drawn from N(0.5, 0.3^2)
tau_i <- rnorm(n, mean = 0.5, sd = 0.3)

## Potential outcomes
y0 <- rnorm(n, mean = 2)
y1 <- y0 + tau_i

## Binary instrument
z <- rbinom(n, 1, 0.5)

## Compliance types:
## Define individual-level threshold (unobserved resistance)
## Low threshold = always-taker, high threshold = never-taker
u_resist <- runif(n)
always_taker <- (u_resist < 0.2)
never_taker  <- (u_resist > 0.7)
complier     <- !always_taker & !never_taker

## Treatment assignment: compliers follow instrument, others don't
d <- ifelse(always_taker, 1,
     ifelse(never_taker, 0,
     z))  # compliers: D = Z

## Make compliers have systematically different treatment effects
## (essential heterogeneity: those who comply have larger effects)
tau_i[complier] <- tau_i[complier] + 0.2

## Observed outcome
y <- ifelse(d == 1, y1, y0)
dat_late <- data.frame(y, d, z, complier, tau_i)

cat("True ATE:                    ", round(mean(tau_i), 3), "\n")
cat("True ATT: ", round(mean(tau_i[d == 1]), 3), "\n")
cat("True LATE (complier effect): ", round(mean(tau_i[complier]), 3), "\n")
```
Now compare OLS, the naive difference in means, and IV:
```{r}
#| label: late-estimates
## OLS (biased: always-takers inflate the treated group)
ols_est <- coef(lm(y ~ d, data = dat_late))["d"]

## Wald / IV estimate
wald_est <- (mean(y[z == 1]) - mean(y[z == 0])) / (mean(d[z == 1]) - mean(d[z == 0]))

## iv_robust
iv_late <- iv_robust(y ~ d | z, data = dat_late)

data.frame(
  Estimand = c("ATE (true)", "LATE (true)", "OLS", "IV / Wald"),
  Value = round(c(mean(tau_i), mean(tau_i[complier]), ols_est, coef(iv_late)["d"]), 3),
  row.names = NULL
)
```
IV recovers the **LATE** --- the effect for compliers --- not the ATE. This is instrument-dependent: a different instrument would identify a different set of compliers with potentially different effects.
### Visualizing compliance types
```{r}
#| label: compliance-types
#| fig-width: 8
#| fig-height: 4
dat_late$type <- ifelse(always_taker, "Always-taker",
                 ifelse(never_taker, "Never-taker", "Complier"))
dat_late$type <- factor(dat_late$type, levels = c("Never-taker", "Complier", "Always-taker"))

ggplot(dat_late, aes(tau_i, fill = type)) +
  geom_histogram(bins = 40, alpha = 0.6, position = "identity") +
  geom_vline(aes(xintercept = mean(tau_i[complier]), color = "LATE"),
             linetype = "dashed", linewidth = 1) +
  geom_vline(aes(xintercept = mean(tau_i), color = "ATE"),
             linetype = "dashed", linewidth = 1) +
  scale_fill_brewer(palette = "Set2") +
  scale_color_manual(values = c("ATE" = "coral", "LATE" = "steelblue"),
                     name = "Estimand") +
  labs(title = "Treatment effects by compliance type",
       subtitle = "IV estimates the LATE (complier average), not the ATE (overall average)",
       x = expression(tau[i] == Y[i](1) - Y[i](0)), fill = "Type")
```
## Applied example: cigarette demand elasticity
We estimate the price elasticity of cigarette demand using state-level panel data from Stock and Watson. Prices are endogenous (supply and demand are jointly determined), so we instrument with cigarette-specific sales taxes.
```{r}
#| label: cigarette-data
data("CigarettesSW", package = "AER")

## Use 1995 cross-section
cig95 <- subset(CigarettesSW, year == "1995")
cig85 <- subset(CigarettesSW, year == "1985")

## Create real variables (deflate by CPI)
cig95$rprice <- cig95$price / cig95$cpi
cig95$rtaxs  <- cig95$taxs / cig95$cpi   # general + cig-specific tax
cig95$rtax   <- cig95$tax / cig95$cpi    # cigarette-specific tax only
cig95$rincome <- cig95$income / (cig95$population * cig95$cpi)

## Log transform for elasticity interpretation
cig95$lnpacks <- log(cig95$packs)
cig95$lnprice <- log(cig95$rprice)
cig95$lnrincome <- log(cig95$rincome)
```
### OLS: biased demand elasticity
```{r}
#| label: cigarette-ols
ols_cig <- lm(lnpacks ~ lnprice + lnrincome, data = cig95)
coeftest(ols_cig, vcov. = vcovHC(ols_cig, type = "HC1"))
```
The OLS price elasticity is likely biased toward zero (or even positive) because high-demand states drive up prices --- simultaneity bias.
### First stage: do taxes predict prices?
```{r}
#| label: cigarette-first-stage
first_stage <- lm(lnprice ~ rtax + lnrincome, data = cig95)
coeftest(first_stage, vcov. = vcovHC(first_stage, type = "HC1"))
cat("\nFirst-stage F-statistic:", round(summary(first_stage)$fstatistic[1], 1), "\n")
```
Taxes strongly predict prices (F well above 10). The instrument is relevant.
### 2SLS: IV demand elasticity
```{r}
#| label: cigarette-iv
iv_cig <- iv_robust(lnpacks ~ lnprice + lnrincome | rtax + lnrincome,
                    data = cig95)
summary(iv_cig)
```
### With two instruments (overidentified)
```{r}
#| label: cigarette-overid
## Use both cigarette-specific tax and general sales tax
iv_cig2 <- iv_robust(lnpacks ~ lnprice + lnrincome | rtax + rtaxs + lnrincome,
                     data = cig95)
summary(iv_cig2)
```
### Comparing OLS and IV
```{r}
#| label: cigarette-comparison
comparison <- data.frame(
  Estimator = c("OLS", "IV (one instrument)", "IV (two instruments)"),
  Elasticity = c(coef(ols_cig)["lnprice"],
                 coef(iv_cig)["lnprice"],
                 coef(iv_cig2)["lnprice"]),
  SE = c(sqrt(vcovHC(ols_cig)["lnprice", "lnprice"]),
         iv_cig$std.error["lnprice"],
         iv_cig2$std.error["lnprice"]),
  row.names = NULL
)
comparison
```
The IV estimate of the price elasticity is more negative than OLS, consistent with the simultaneity story: OLS understates the (negative) demand response because high demand pushes prices up.
### Diagnostics
```{r}
#| label: cigarette-diagnostics
## Hausman test via control function
cig95$v_hat <- residuals(lm(lnprice ~ rtax + lnrincome, data = cig95))
cf_cig <- lm(lnpacks ~ lnprice + lnrincome + v_hat, data = cig95)
cat("Hausman test (t on v_hat):\n")
coeftest(cf_cig, vcov. = vcovHC(cf_cig, type = "HC1"))["v_hat", , drop = FALSE]
```
```{r}
#| label: cigarette-sargan
## Sargan test (overidentified model with 2 instruments)
e_iv <- cig95$lnpacks - iv_cig2$fitted.values
sargan_cig <- lm(e_iv ~ rtax + rtaxs + lnrincome, data = cig95)
J <- nrow(cig95) * summary(sargan_cig)$r.squared
cat("\nSargan J-stat:", round(J, 3), "  p-value:", round(1 - pchisq(J, 1), 3), "\n")
```
## Comparing IV coefficients across two independent samples
A common question: *is the causal effect the same in subgroup A as in subgroup B?* Run IV separately in each subgroup, then test whether the two slope estimates are statistically different.
Setup: two independent random samples (e.g., women and men) with the same model in each:
$$
y_{ji} = \bm{x}_{ji}'\bm{\beta}_j + e_{ji}, \quad \mathbb{E}[\bm{z}_{ji} e_{ji}] = 0, \qquad j \in \{1, 2\}.
$$
Each sample is just identified ($\dim \bm{z}_{ji} = \dim \bm{x}_{ji}$). Test $H_0: \bm{\beta}_1 = \bm{\beta}_2$.
Each estimator is asymptotically normal with the standard IV sandwich variance:
$$
\sqrt{n}\bigl(\hat{\bm{\beta}}_j - \bm{\beta}_j\bigr) \xrightarrow{d} N(0, V_j), \qquad
V_j = Q_j^{-1} \Omega_j Q_j^{-1\prime}.
$$
Because the two samples come from disjoint individuals, $\hat{\bm{\beta}}_1$ and $\hat{\bm{\beta}}_2$ are *asymptotically independent*. So the variance of the difference is the *sum* of the individual variances --- no covariance term:
$$
\sqrt{n}\Bigl((\hat{\bm{\beta}}_1 - \bm{\beta}_1) - (\hat{\bm{\beta}}_2 - \bm{\beta}_2)\Bigr) \xrightarrow{d} N(0, V_1 + V_2),
$$
$$
W_n = n(\hat{\bm{\beta}}_1 - \hat{\bm{\beta}}_2)'\bigl(\hat{V}_1 + \hat{V}_2\bigr)^{-1}(\hat{\bm{\beta}}_1 - \hat{\bm{\beta}}_2) \xrightarrow{d} \chi^2_k.
$$
A simulated example. Generate two samples with potentially different slopes $\beta_1, \beta_2$:
```{r}
#| label: two-sample-iv-dgp
set.seed(42)

make_sample <- function(beta, n) {
  z <- rnorm(n)
  v <- rnorm(n)
  e <- 0.6 * v + rnorm(n, sd = 0.5)
  x <- 1.5 * z + v             # x is endogenous
  y <- 1 + beta * x + e
  data.frame(y = y, x = x, z = z)
}

n <- 1500
women <- make_sample(beta = 0.5, n)
men   <- make_sample(beta = 0.7, n)        # different effect by 0.2
```
Fit IV separately in each sample with a heteroskedasticity-robust variance:
```{r}
#| label: two-sample-iv-fit
iv_w <- iv_robust(y ~ x | z, data = women)
iv_m <- iv_robust(y ~ x | z, data = men)

c(women_beta = unname(coef(iv_w)["x"]),
  men_beta   = unname(coef(iv_m)["x"]),
  women_se   = unname(iv_w$std.error["x"]),
  men_se     = unname(iv_m$std.error["x"]))
```
Form the Wald statistic by hand. The slope is one-dimensional, so the variance of the difference is just $\hat{V}_1 + \hat{V}_2$ (a sum of scalars):
```{r}
#| label: two-sample-iv-wald
b_diff   <- coef(iv_w)["x"] - coef(iv_m)["x"]
v_diff   <- iv_w$std.error["x"]^2 + iv_m$std.error["x"]^2

W_stat <- b_diff^2 / v_diff                   # one restriction
p_W    <- 1 - pchisq(W_stat, df = 1)

c(diff = unname(b_diff),
  SE_diff = unname(sqrt(v_diff)),
  W = unname(W_stat),
  p = unname(p_W))
```
The estimated difference (≈ −0.2) is large relative to its standard error, the Wald statistic is well into the rejection region, and the p-value is essentially zero --- as it should be, since the DGP gave us $\beta_w = 0.5$, $\beta_m = 0.7$.
A quick size check: rerun with the *same* slope in both samples, and the test should fail to reject:
```{r}
#| label: two-sample-iv-size
set.seed(42)
women_eq <- make_sample(beta = 0.6, n)
men_eq   <- make_sample(beta = 0.6, n)        # same slope

iv_w_eq <- iv_robust(y ~ x | z, data = women_eq)
iv_m_eq <- iv_robust(y ~ x | z, data = men_eq)

W_eq <- (coef(iv_w_eq)["x"] - coef(iv_m_eq)["x"])^2 /
        (iv_w_eq$std.error["x"]^2 + iv_m_eq$std.error["x"]^2)
c(W = unname(W_eq), p = 1 - pchisq(W_eq, df = 1))
```
Correct size: under the null the test fails to reject.
The same template extends to $k > 1$ regressors --- replace the scalar variances by their sandwich $\hat V_1, \hat V_2$ matrices and use the matrix-form Wald
$W_n = n(\hat\beta_1 - \hat\beta_2)'(\hat V_1 + \hat V_2)^{-1}(\hat\beta_1 - \hat\beta_2)$
distributed as $\chi^2_k$ under $H_0$.
## When TSLS-with-controls isn't LATE: Dube & Vargas (2013)
Up to here we have presented IV under heterogeneity as estimating a LATE on compliers. That story is exactly correct for the **Wald** estimator (binary $Z$, no covariates). It is *not* generally correct for **TSLS with covariates** — which is what almost all applied IV papers actually report.
[Blandhol, Bonney, Mogstad, and Torgovitsky (2025)](https://www.nber.org/papers/w27331) — "BBMT" — show that TSLS-with-controls reflects compliers *and* always-takers, and that some always-taker weights are necessarily negative, unless a strong condition called **rich covariates** holds. Rich covariates is essentially that the controls $X$ enter the model flexibly enough that the linear projection $\mathbb{L}[Z\mid X]$ coincides with the conditional mean $\mathbb{E}[Z\mid X]$. Linear-in-FE specifications almost never satisfy this.
This section walks through their recommended workflow on a real applied IV paper: Dube and Vargas (2013), "Commodity Price Shocks and Civil Conflict: Evidence from Colombia."
### The setup, in one paragraph
Dube and Vargas ask whether commodity-price shocks affect violence in Colombian municipalities. The mechanism is labor-market: a rise in the price of a *labor-intensive* commodity (coffee) raises local wages, raises the opportunity cost of joining an armed group, and reduces violence. Their identification strategy is an interaction instrument: $Z_{it} = E_i \times P_t$, where $E_i$ is municipality $i$'s pre-period coffee exposure and $P_t$ is the world coffee price. World prices are exogenous to violence in any one Colombian municipality (a small-open-economy argument); local exposure is a fixed geographic feature. The interaction shifts local economic conditions through the labor-market channel they hypothesize.
The structural specification is
$$\text{Violence}_{it} = \alpha_i + \gamma_t + \beta\,(E_i P_t) + \delta\,\text{lpop}_{it} + \varepsilon_{it},$$
with municipality fixed effects $\alpha_i$, year fixed effects $\gamma_t$, log population as a control, and three instruments $(Z_{1it}, Z_{2it}, Z_{3it})$ that are alternative interactions of coffee exposure with world-price proxies. We focus on one outcome — *guerrilla attacks per 1000 population* (`gueratt`) — and one endogenous regressor (the coffee interaction).
### Load the data
```{r}
#| label: dube-load
#| message: false
library(haven)
library(fixest)
library(lmtest)
library(sandwich)
library(ddml)
library(glmnet)

dube <- read_dta("data/origmun_violence_commodities.dta")
dube <- subset(dube, !is.na(cofintxlinternalp))   # drop missings on endogenous regressor
cat("rows:", nrow(dube),
    "  munis:", length(unique(dube$origmun)),
    "  years:", min(dube$year), "to", max(dube$year), "\n")
```
`dube` is an unbalanced panel: ~17,600 municipality-year observations across 998 municipalities and 18 years (1988–2005).
### Step 1: TSLS with linear FE (the "standard" specification)
Estimate the structural equation via 2SLS, with municipality and year fixed effects entered linearly and three coffee instruments. We use heteroskedasticity-robust standard errors here for simplicity (the original paper clusters at the department level).
```{r}
#| label: dube-tsls
tsls <- feols(
  gueratt ~ lpop | origmun + year |
    cofintxlinternalp ~ rxltop3cof + txltop3cof + rtxltop3cof,
  data = dube, vcov = "hetero"
)
summary(tsls)
```
The TSLS estimate of $\beta$ on the coffee interaction is the headline number — under the standard interpretation, "the LATE of coffee-driven economic activity on guerrilla attacks." The BBMT critique asks: is that interpretation actually warranted here?
### Step 2: Why rich covariates is implausible here
The instrument is $Z_{it} = E_i \times P_t$ — a *multiplicative* function of a muni-fixed exposure and a year-varying price. After conditioning on muni FE (which absorb $E_i$-level effects) and year FE (which absorb $P_t$-level effects), the residual variation in $Z$ is the interaction itself.
A linear projection $\mathbb{L}[Z\mid X]$ with FE entered additively is at most $\alpha_i + \gamma_t$. It cannot reproduce the multiplicative structure $E_i \cdot P_t$. So $\mathbb{E}[Z\mid X] \neq \mathbb{L}[Z\mid X]$ — rich covariates fails by construction outside a fully-saturated muni $\times$ year specification, which would absorb all the identifying variation.
The Ramsey RESET test detects this kind of misspecification. It adds polynomial powers of the fitted values $\hat{Z} = \mathbb{L}[Z\mid X]$ to the regression of $Z$ on $X$ and tests whether they jointly contribute. Rejection means the linear projection is missing systematic variation — i.e., rich covariates fails.
### Step 3: Run the RESET test
We run RESET on each of the three instruments separately. (When there are multiple instruments, BBMT recommend a bootstrapped joint version; for a teaching walkthrough, looking at each instrument is informative.)
```{r}
#| label: dube-reset
#| message: false
reset_one <- function(z) {
  ## Step 1: regress instrument on controls (linear FE specification)
  fit <- feols(as.formula(paste(z, "~ lpop | origmun + year")), data = dube)
  zhat <- fitted(fit)
  ## Step 2: add polynomial powers of fitted values, test joint significance
  d <- dube
  d$zhat2 <- zhat^2
  d$zhat3 <- zhat^3
  fit_aug <- feols(as.formula(paste(z, "~ lpop + zhat2 + zhat3 | origmun + year")),
                   data = d, vcov = "hetero")
  wt <- fixest::wald(fit_aug, c("zhat2", "zhat3"))
  c(F = unname(wt$stat), p = unname(wt$p))
}

reset_results <- t(sapply(c("rxltop3cof", "txltop3cof", "rtxltop3cof"), reset_one))
round(reset_results, 4)
```
If the RESET p-values are small (all clearly below 0.05), the linear-in-FE specification fails to capture $\mathbb{E}[Z\mid X]$ — rich covariates is rejected, and the LATE interpretation of TSLS is unjustified. The estimand mixes complier and always-taker effects, with some always-taker weights necessarily negative.
### Step 4: DoubleML PLIV — relaxing the linear-FE assumption
The fix BBMT recommend is to estimate $\beta$ via **partially linear IV** (PLIV) with the conditional means $\mathbb{E}[Y\mid X]$ and $\mathbb{E}[Z\mid X]$ estimated *nonparametrically* by ML, with sample-splitting (cross-fitting) to avoid first-stage bias contaminating $\hat{\beta}$. The model is
$$Y = D\beta + g(X) + e, \qquad Z = m(X) + v, \qquad \mathbb{E}[v\mid X]=0.$$
`g` and `m` are estimated by an ML learner (lasso, random forest, gradient boosting, ...). The Neyman-orthogonal score residualizes $Y$ and $Z$ against the estimated $\hat{g}, \hat{m}$ and runs IV on the residuals.
We use the `ddml` package with lasso (`glmnet`) as the learner — fast and well-suited to our high-dimensional design (998 muni dummies + 18 year dummies + lpop). Cross-fitting uses 5 folds.
Two implementation details matter for speed:
- We build the design matrix as a *sparse* matrix using `Matrix::sparse.model.matrix`. The dense expansion is ~135 MB; the sparse version is ~1.8 MB and `glmnet` consumes it directly.
- We pass `shortstack = TRUE` to `ddml_pliv`. The default runs an inner cross-validation loop to compute ensemble weights across multiple ML learners — but with one learner the ensemble weight is trivially 1, so the inner loop is pure overhead. `shortstack` skips it. With these two changes, the chunk runs in roughly 20 seconds; without them, several minutes.
```{r}
#| label: dube-ddml
#| cache: true
#| message: false
## Build the design matrix: muni dummies, year dummies, lpop -- sparse for glmnet
X <- Matrix::sparse.model.matrix(
  ~ factor(origmun) + factor(year) + lpop, data = dube
)[, -1]
y <- dube$gueratt
D <- dube$cofintxlinternalp
Z <- as.matrix(dube[, c("rxltop3cof", "txltop3cof", "rtxltop3cof")])

set.seed(42)
ddml_fit <- ddml_pliv(
  y = y, D = D, Z = Z, X = X,
  learners      = list(list(fun = ddml::mdl_glmnet)),
  sample_folds  = 5,
  shortstack    = TRUE,
  silent        = TRUE
)
summary(ddml_fit)
```
`ddml_pliv` reports the PLIV point estimate and a heteroskedasticity-robust standard error. Because $g(X)$ and $m(X)$ are estimated nonparametrically, the rich-covariates condition is satisfied by construction (asymptotically), so PLIV delivers $\beta_{\text{rich}}$ — a non-negatively-weighted average of conditional LATEs.
### Step 5: Compare TSLS and DDML PLIV
```{r}
#| label: dube-compare
tsls_b  <- coef(tsls)["fit_cofintxlinternalp"]
tsls_se <- summary(tsls)$se["fit_cofintxlinternalp"]

ddml_summary <- summary(ddml_fit)
ddml_b  <- ddml_summary["D_r", "Estimate",   "nnls"]
ddml_se <- ddml_summary["D_r", "Std. Error", "nnls"]

data.frame(
  Estimator = c("TSLS (linear FE)", "DDML PLIV (lasso)"),
  Estimate  = c(tsls_b,  ddml_b),
  SE        = c(tsls_se, ddml_se),
  row.names = NULL
)
```
If the two estimates are similar in magnitude, the linear-in-FE specification was approximately right and TSLS is approximately weakly causal — even if RESET technically rejects. If they differ, the linear-FE specification was hiding signal, and the headline TSLS number is mixing in negatively-weighted always-taker effects.
A third quantity worth knowing — the *unconditional* ACR/LATE — would require a binary instrument and a separate IPSW or DDML implementation. Dube–Vargas instruments are continuous, so we stop at the PLIV step here.
### Reading the result
Three observations:
1. **RESET rejected, hard.** All three instruments produce $F$-statistics far above any conventional threshold, with p-values indistinguishable from zero. The linear-FE specification is decisively *not* a faithful representation of $\mathbb{E}[Z\mid X]$. By BBMT, the LATE interpretation of the TSLS estimate is unjustified.
2. **The estimates differ.** DDML PLIV gives $\hat\beta \approx -1.02$ versus TSLS's $\hat\beta \approx -0.78$ — about 30% more negative in magnitude. This is the divergence RESET predicted. The qualitative finding (coffee price shocks reduce guerrilla violence) survives, but the magnitude moves meaningfully when we stop forcing the conditional means to be linear in additively-entered FE.
3. **What we have not done.** PLIV gives $\beta_{\text{rich}}$ — a non-negatively-weighted average of conditional LATEs. It does not give us the *unconditional* LATE, which is what most readers implicitly imagine when they read an IV coefficient. Recovering that is a separate problem (BBMT recommendation #4: estimate the unconditional ACR via DDML or IPSW), and is much harder when the instrument is continuous as it is here.
The take-away is not that Dube–Vargas got the wrong answer. It is that "TSLS with controls = LATE on compliers" — the way IV estimates are routinely interpreted in applied work — is a stronger claim than the spec actually supports. Running RESET tells you whether you've earned that interpretation; DDML PLIV is a principled alternative when you haven't.
## Connection to GMM
IV and 2SLS are special cases of the **Generalized Method of Moments** (GMM). We will see in Chapter 11 that 2SLS is a [special case of GMM](ch11-gmm.qmd#thm-gmm-2sls). The moment condition $E[Z_i(Y_i - X_i'\beta)] = 0$ defines both:
| Method | Weighting matrix $\hat{W}$ | When optimal? |
|--------|---------------------------|---------------|
| IV (just-identified) | $(Z'Z/n)^{-1}$ | Always (unique solution) |
| 2SLS | $(Z'Z/n)^{-1}$ | Under homoskedasticity |
| Efficient GMM | $\hat{\Omega}^{-1}$ | Under heteroskedasticity |
Under homoskedasticity, 2SLS is efficient among all IV estimators. Under heteroskedasticity, efficient GMM does better by weighting moment conditions inversely to their variance.
The **Sargan/J-test** is the overidentification test of GMM: it checks whether the extra moment conditions (beyond what is needed for identification) are satisfied. We develop the full GMM framework in Chapter 11.